leaflet.jsの地図に駅のレイヤーをオーバーレイする
前回作ったtopojsonをleaflet.jsを使って描画した日本地図に載せていきます。
方法としてはD3.jsでjsonを読み込んでレイヤーを作り、日本地図にオーバーレイする。
では始めます。
(鉄道データ引用元)
複数のjsonファイルを読み込む
今回駅情報を記述したstation.jsonと線路情報を記述したrail.jsonを同時に読み込む必要があったため以下のように記述した。
d3.json("rail_road.json", function(railjson){
    d3.json("Station.json", function(stationjson) {
        railDraw(railjson, stationjson);
    });
});
この方法だとjsonファイルが何個もあるときどんどん深くなっていくのでおすすめできないかも… shpファイルをQGISなどを使って一つにまとめる方法や前のブログでやった変換時に複数のgeojsonファイルを指定して、一つのtopojsonに吐く方法などあるらしいのでそちらを使った方が良いかもしれない
leafletの地図にオーバーレイ
leaflet.jsで生成した地図にオーバーレイでレイヤー(svg)を追加する方法
var svg = d3.select(map.getPanes().overlayPane)
    .append("svg")
    .attr('class', 'leaflet-zoom-hide')
    .attr({width:960,height:500});
線路情報の描画
線路情報はjsonファイルの中を覗くとわかるが、緯度経度のリストがいくつも並んでいる形式になっている。以下例
"features": [
{ "type": "Feature", "properties": { "N02_001": "23", "N02_002": "5", "N02_003": "沖縄都市モノレール線", "N02_004": "沖縄都市モノレール" }, "geometry": { "type": "LineString", "coordinates": [ [ 127.67948, 26.21454 ], [ 127.6797, 26.21474 ], [ 127.67975, 26.2148 ], [ 127.68217, 26.21728 ], [ 127.68357, 26.21862 ], [ 127.68394, 26.21891 ], [ 127.68419, 26.21905 ] ] } },
{ "type": "Feature", "properties": { "N02_001": "12", "N02_002": "5", "N02_003": "いわて銀河鉄道線", "N02_004": "アイジーアールいわて銀河鉄道" }, "geometry": { "type": "LineString", "coordinates": [ [ 141.29139, 40.3374 ], [ 141.29176, 40.33723 ], [ 141.29243, 40.33692 ], [ 141.29323, 40.33654 ], [ 141.29379, 40.33624 ], [ 141.29411, 40.33608 ], [ 141.2949, 40.33563 ], [ 141.29624, 40.33477 ], [ 141.29813, 40.33354 ], [ 141.29862, 40.33317 ] ] } },
{ "type": "Feature", "properties": { "N02_001": "12", "N02_002": "5", "N02_003": "いわて銀河鉄道線", "N02_004": "アイジーアールいわて銀河鉄道" }, "geometry": { "type": "LineString", "coordinates": [ [ 141.27554, 40.23936 ], [ 141.27567, 40.23884 ], [ 141.27587, 40.23827 ], [ 141.27622, 40.23756 ], [ 141.27656, 40.23694 ], [ 141.27722, 40.23579 ], [ 141.27789, 40.23462 ], [ 141.27856, 40.23344 ], [ 141.27922, 40.23236 ], [ 141.27983, 40.23153 ], [ 141.28006, 40.23123 ], [ 141.28011, 40.23118 ], [ 141.28034, 40.23094 ], [ 141.28092, 40.23042 ], [ 141.28207, 40.22963 ], [ 141.28328, 40.22883 ], [ 141.28345, 40.22874 ] ] } },
{ "type": "Feature", "properties": { "N02_001": "12", "N02_002": "5", "N02_003": "いわて銀河鉄道線", "N02_004": "アイジーアールいわて銀河鉄道" }, "geometry": { "type": "LineString", "coordinates": [ [ 141.28659, 40.26092 ], [ 141.28538, 40.25874 ] ] } },
...
このgeometryの部分がそうである。これをsvgのpath要素で結んでいくイメージ
以下にD3でsvg要素にpathを追加していく例を記述します。
var g1 = svg.append("g");

//緯度経度->パスジェネレーター関数作成
var transform = d3.geo.transform({point: projectPoint});
var path = d3.geo.path().projection(transform);

 featureElement = g1.selectAll("path")
    .data(geo_rail_json.features)
    .enter()
    .append("path")
    .attr({
        "stroke": "red",
        "fill": "green",
        "fill-opacity": 0.4,
    });

function projectPoint(x, y) {
    var point = map.latLngToLayerPoint(new L.LatLng(y, x));
    this.stream.point(point.x, point.y);
}
上記のソースはネットでググったら同じようなものが色々出てきてそれを引用しましたが、いまいち何やっているかわからぬ。。 勉強しなければいけませんね
駅情報のプロット
駅情報を記述したjsonファイルであるstation.jsonはこんな感じ
"features": [
{ "type": "Feature", "properties": { "N02_001": "11", "N02_002": "2", "N02_003": "指宿枕崎線", "N02_004": "九州旅客鉄道", "N02_005": "二月田" }, "geometry": { "type": "LineString", "coordinates": [ [ 130.63035, 31.25405 ], [ 130.62985, 31.25459 ] ] } },
{ "type": "Feature", "properties": { "N02_001": "23", "N02_002": "5", "N02_003": "沖縄都市モノレール線", "N02_004": "沖縄都市モノレール", "N02_005": "古島" }, "geometry": { "type": "LineString", "coordinates": [ [ 127.70279, 26.23035 ], [ 127.70309, 26.23093 ] ] } },
{ "type": "Feature", "properties": { "N02_001": "24", "N02_002": "5", "N02_003": "東京臨海新交通臨海線", "N02_004": "ゆりかもめ", "N02_005": "お台場海浜公園" }, "geometry": { "type": "LineString", "coordinates": [ [ 139.77818, 35.62961 ], [ 139.77888, 35.63 ] ] } },
...
なぜか緯度経度の組みが2つずつあるような形式。おそらく南東と北西の点を取ってきているイメージ。四角形にすると右斜め下と左斜め上の点の緯度経度(わかりにくい)
これらを考慮しプロットするソースが以下の通りである
var g2 = svg.append("g");


geo_station_json.features.forEach(function(d){
    d.LatLng = new L.LatLng(d.geometry.coordinates[0][1], d.geometry.coordinates[0][0]);
});


stationElement = g2.selectAll("image")
    .data(geo_station_json.features)
    .enter()
    .append("image")
    .attr({"xlink:href":"./station.svg",
        "width":15,
        "height":10,
       });
今回はプロットする点を画像にしました。いつも通りだとsvgにcircle要素を追加していくのですが、image要素を追加していくことで画像がプロットされます。
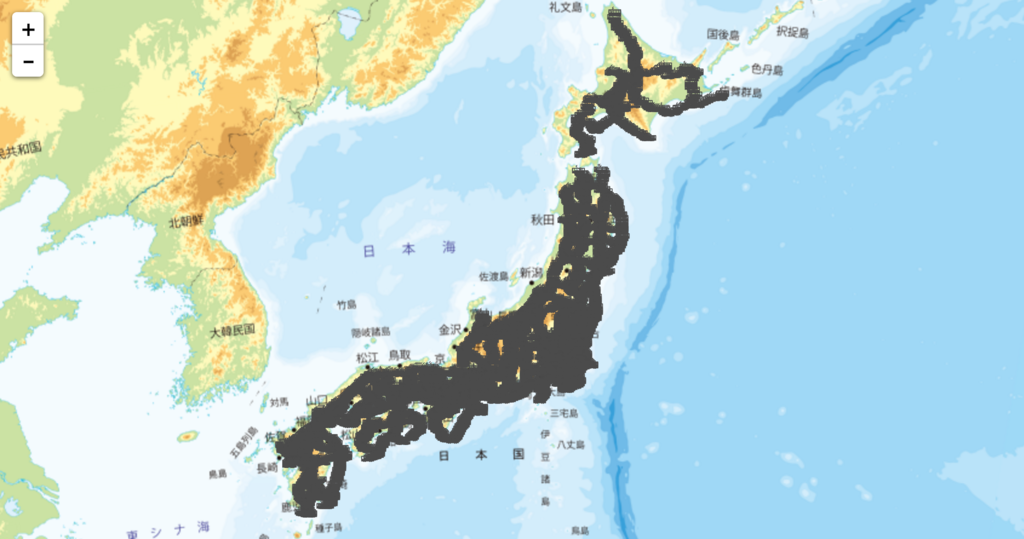
完成図
こちらが今回作った駅と線路をleaflet.jsに追加した地図です。

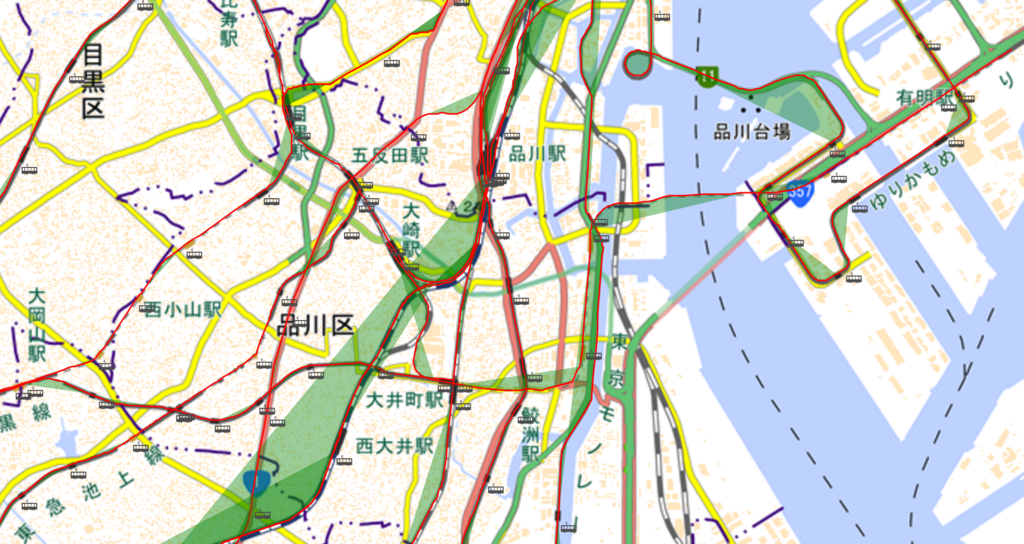
気持ち悪い…拡大すると

なんかずれてる 直すのはまた今度にします。
今回作ったもの GitHub - hiracky16/RailRoad